效果示例
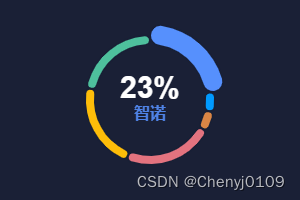
代码汇总
pieCharts() {let data = [];const providerResult = [{name: '智诺', value: 23},{name: '海康', value: 5},{name: '大华', value: 5}, {name: '云科', value: 23},{name: '四信', value: 22},{name: '九物', value: 22}]let charts = echarts.init(document.getElementById('manufactureCharts'));let color = ['#4f83e6','#009aff','#db8645','#e3737f','#febd09','#4ec09d']let option = this.getPieOption(providerResult, color);charts.setOption(option, true);tools.loopShowTooltip(charts, option, {loopSeries: true,interval:5000})},
getPieOption(typeDatas, color1) {let width = window.innerWidth;let fontSize1 = 30;let fontSize2 = 16;let height = 20;let data = [];let color = color1for (let i = 0; i < typeDatas.length; i++) {data.push({value: typeDatas[i].value,name: typeDatas[i].name,avoidLabelOverlap: false,label: {show: false,position: 'center',formatter: '{numberText|{c}%}\n{textStyle|{b}}',rich: {numberText: {color: '#fff',fontSize: fontSize1,fontFamily: 'Avenir, Helvetica, Arial, sans-serif',fontWeight:700},textStyle: {color: color[i],fontSize: fontSize2,fontFamily: 'SourceHanSansSC-Medium',height: height,fontWeight:700}}},emphasis: {label: {show: true,fontWeight: 'bold'}},itemStyle: {normal: {borderWidth: 2,borderColor: '#181F35',color: color[i],}}},);}let seriesOption = [{name: '',type: 'pie',radius: ['55%', '65%'],itemStyle: {borderRadius: 50,borderColor: '#181F35',borderWidth: 55,},emphasis: {disabled: false,scale: true,scaleSize: 11,label : {show: true,fontSize: '100',fontWeight: 'bold'}},data: data}];let option = {tooltip: {show: false,trigger: 'item'},toolbox: {show: false},series: seriesOption};return option;},
