MATLAB | 情人节画个花瓣venn图?

之前七夕节情人节各种花,相册,爱心啥的都快画够了,今年画个花瓣韦恩图?
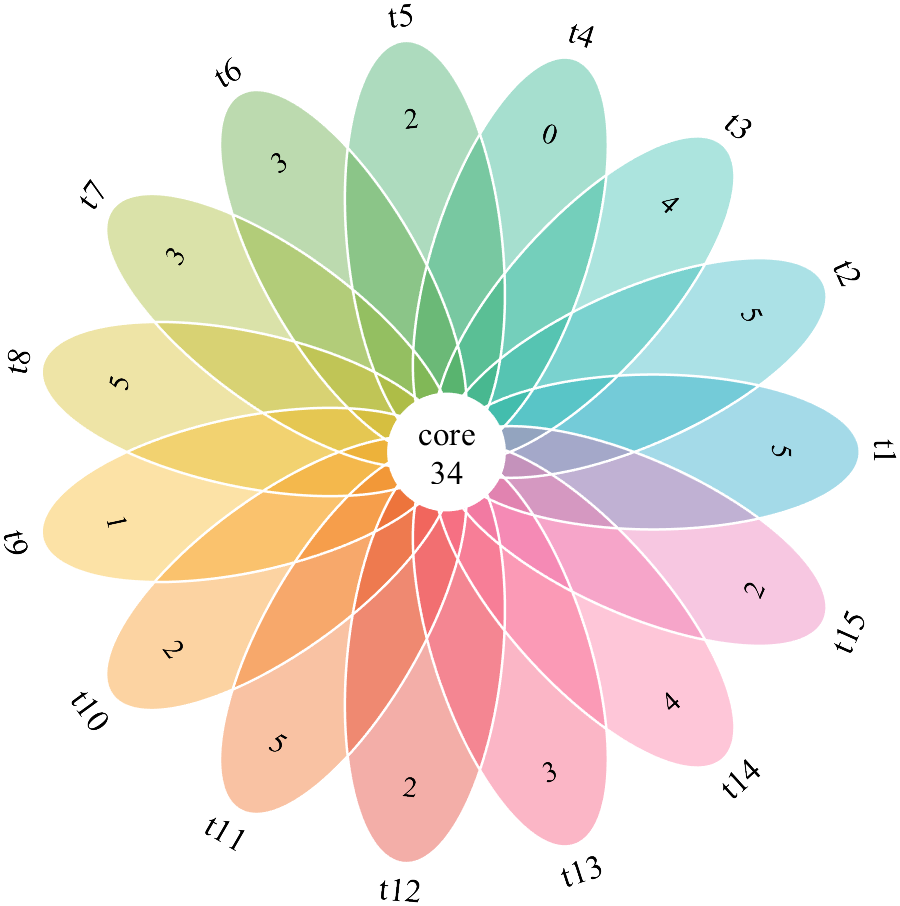

花瓣上的数字是仅属于该类的样本数,而中心的数字是属于每一类的样本数
教程部分
0 数据准备
% 给组起名t1 t2 t3...t15
setName = compose('t%d', 1:15);% 随机生成数据
Data = [rand(200, 15) > .1; rand(200, 15) > .85];% 设置字体
numFont = {'FontSize', 14, 'FontName', 'Times New Roman'};
labFont = {'FontSize', 16, 'FontName', 'Times New Roman'};
其中Data数据是个0-1矩阵,矩阵每一行代表一个样本,如果第n列是1代表该样本属于第n类,是0则代表不属于。
1 配色
CList = lines(15);
% C = flowerPlotColor();
% CList = C.CList631;
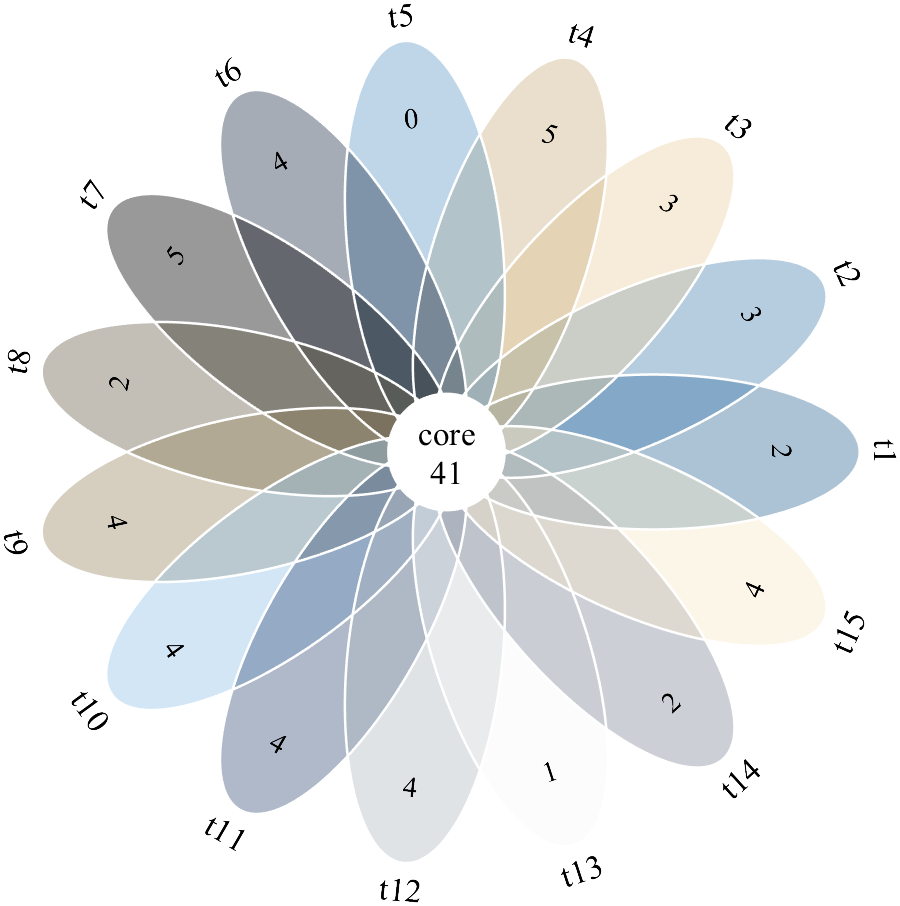
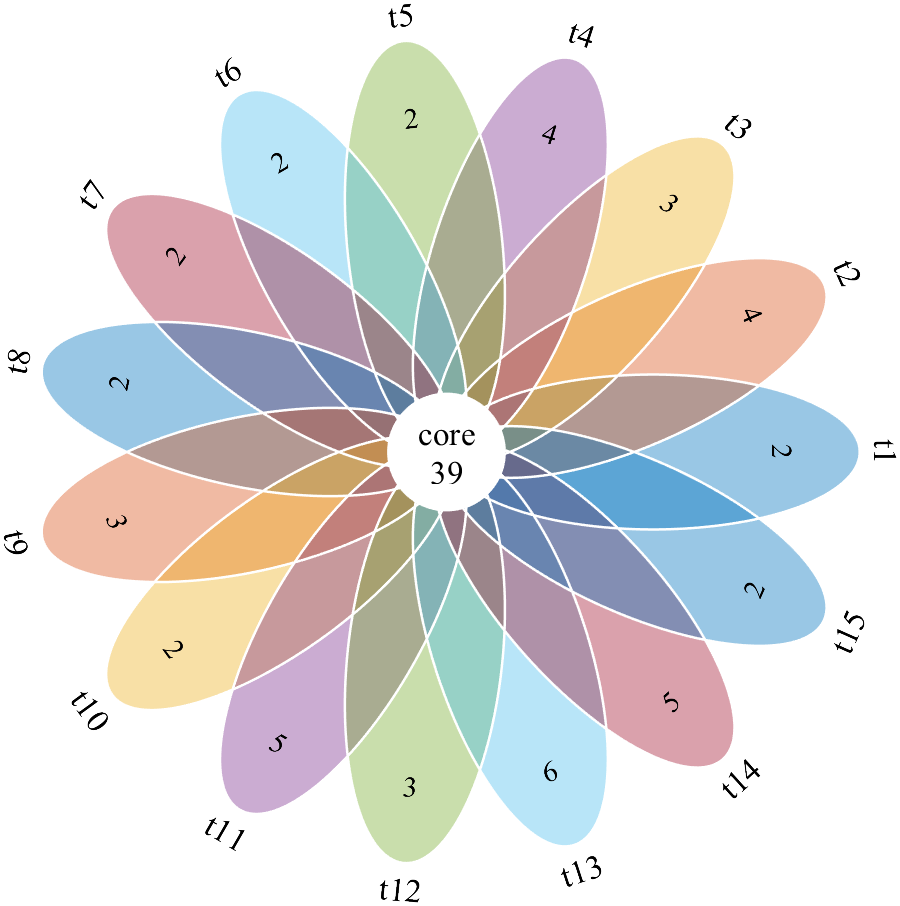
这里直接取MATLAB自带的lines配色,当然我也准备了很多其他配色,可以复制下来用:
function C=flowerPlotColor
C.CList1877 = [0.2431    0.3294    0.58820.5098    0.5647    0.73330    0.5569    0.80780.3490    0.7804    0.92160.0275    0.4431    0.52940.4157    0.6667    0.71760.0392    0.5647    0.52550.3294    0.7490    0.71760.5569    0.1255    0.26270.7373    0.4784    0.56080.8784    0.3765    0.49410.9255    0.6275    0.69800.9961    0.6275    0.56470.9961    0.8118    0.78040.7216    0.7373    0.75690.8824    0.8863    0.8980];
C.CList1514 = [0.4078    0.5647    0.81570.9098    0.7843    0.65880.9725    0.8784    0.72160.9725    0.9725    0.97250.2196    0.3137    0.43920.5333    0.6588    0.97250         0         00.5961    0.5961    0.69020.3451    0.4706    0.56470.8471    0.8471    0.97250.7216    0.7216    0.81570.8157    0.6902    0.56470.7216    0.5961    0.47060.2510    0.4078    0.62750.7216    0.7843    0.9725];
C.CList1596 = [0.2549    0.5490    0.94120.9882    0.7059    0.25490.8784    0.2510    0.03920.0196    0.3922    0.57250.7490    0.7490    0.74900.1020    0.2314    0.41181.0000    0.8902    0.50980.0706    0.6118    0.86670.7922    0.4196    0.29410    0.3608    0.85880.9529    0.8235    0.53330.3137    0.3882    0.50590.9451    0.7255    0.65880.8784    0.5137    0.03920.4706    0.5765    0.7451];
C.CList1470 = [0.1882    0.4078    0.59610.2824    0.5020    0.69020.9098    0.8157    0.62750.7843    0.6902    0.50200.3765    0.5961    0.78430.1255    0.1882    0.28240         0         00.4078    0.3765    0.28240.5961    0.5333    0.37650.5647    0.7529    0.90980.2196    0.3137    0.47060.6902    0.7216    0.75290.9725    0.9725    0.97250.5020    0.5333    0.59610.9725    0.9098    0.7843];
C.CList1827 = [1.0000    0.6118         00.9686    0.7412    0.35291.0000    0.8000    0.60001.0000    1.0000    0.20001.0000    1.0000    0.61180.8039    0.3882    0.38820.8000    0.6000    0.80001.0000    0.6196    0.38820.3922    0.4275    0.80000.6118    0.6118    1.00000.2000    0.6000    1.00000.6000    0.8000    1.00001.0000    1.0000    0.80000.6941    0.5843    0.47840.9294    0.5333    0.29800.9608    0.9294         00.8667    1.0000    1.0000];
C.CList1607 = [0.8863    0.5686    0.56860.6000    0.8667    0.57250.5765    0.8471    0.72550.5804    0.7686    0.82750.5804    0.6039    0.80780.7020    0.5804    0.80000.8000    0.5882    0.69410.8000    0.6431    0.60000.8745    0.8980    0.57251.0000    0.6471    0.37650.4196    1.0000    0.38820.3961    1.0000    0.80000.3961    0.7686    1.00000.3961    0.4196    1.00000.6784    0.3961    1.00001.0000    0.3961    0.95691.0000    0.3961    0.51761.0000    0.3961    0.3961];
C.CList631 = [0.1059    0.6392    0.77650.1725    0.7098    0.75290.1882    0.7373    0.67840.1294    0.6902    0.52940.2000    0.6510    0.36080.3412    0.6392    0.21570.6353    0.7137    0.15290.8353    0.7333    0.12940.9725    0.7137    0.12550.9725    0.5725    0.09020.9412    0.4039    0.09800.8784    0.2039    0.14900.9647    0.2863    0.44310.9882    0.4431    0.61960.9216    0.4510    0.70200.8078    0.4118    0.74510.6353    0.4275    0.76080.4706    0.4510    0.75290.3098    0.4863    0.7294];
end


2 数据处理及图窗生成
% 数据计算
cT = linspace(0, 2*pi, 200);
cX = cos(cT).*8 + 8;
cY = sin(cT).*3;
cXY = [cX;cY];
setNum = size(Data, 2);
rT = 2*pi./setNum;
rM = [cos(rT),-sin(rT); sin(rT),cos(rT)];uniq = sum(Data.*(sum(Data,2) == 1),1);
core = sum(sum(Data,2) == setNum);figure('Units', 'normalized', 'Position', [.1,.1,.5,.8]);
ax=gca;
ax.NextPlot = 'add';
ax.DataAspectRatio = [1,1,1];
ax.XColor = 'none';
ax.YColor = 'none';
3 绘制花
% 绘制椭圆花瓣
for i = 0:setNum-1iXY = rM^i*cXY;fill(iXY(1,:), iXY(2,:), CList(i+1,:), 'FaceAlpha', .4, 'EdgeColor', 'none');
end
% 绘制白色边缘线
if 1
for i = 0:setNum-1iXY = rM^i*cXY;plot(iXY(1,:), iXY(2,:), 'Color', 'w', 'LineWidth', 1.2);
end
end
fill(cos(cT).*2.3, sin(cT).*2.3, [1,1,1], 'EdgeColor', 'none')

4 绘制文本
% 绘制文本信息
for i = 1:setNumtR = (i-1)*rT/pi*180;if tR>=0 && tR<=180tR = tR-90;elsetR = tR+90;endtext(cos((i-1)*rT).*13, sin((i-1)*rT).*13, num2str(uniq(i)),...'HorizontalAlignment', 'center',...'VerticalAlignment', 'middle',...'Rotation', tR,...numFont{:})text(cos((i-1)*rT).*17, sin((i-1)*rT).*17, setName{i},...'HorizontalAlignment', 'center',...'VerticalAlignment', 'middle',...'Rotation', tR,...labFont{:})
end
text(0, 0, {'core';num2str(core)},...'HorizontalAlignment', 'center',...'VerticalAlignment', 'middle',...labFont{:})
完整代码
% flowerPlotDemo% 给组起名t1 t2 t3...t15
setName = compose('t%d', 1:15);% 随机生成数据
Data = [rand(200, 15) > .1; rand(200, 15) > .85];% 设置字体
numFont = {'FontSize', 14, 'FontName', 'Times New Roman'};
labFont = {'FontSize', 16, 'FontName', 'Times New Roman'};% 设置配色
CList = lines(15);
% C = flowerPlotColor();
% CList = C.CList631;% =========================================================
% 绘图部分代码
% ---------------------------------------------------------
% 数据计算
cT = linspace(0, 2*pi, 200);
cX = cos(cT).*8 + 8;
cY = sin(cT).*3;
cXY = [cX;cY];
setNum = size(Data, 2);
rT = 2*pi./setNum;
rM = [cos(rT),-sin(rT); sin(rT),cos(rT)];uniq = sum(Data.*(sum(Data,2) == 1),1);
core = sum(sum(Data,2) == setNum);figure('Units', 'normalized', 'Position', [.1,.1,.5,.8]);
ax=gca;
ax.NextPlot = 'add';
ax.DataAspectRatio = [1,1,1];
ax.XColor = 'none';
ax.YColor = 'none';% 绘制椭圆花瓣
for i = 0:setNum-1iXY = rM^i*cXY;fill(iXY(1,:), iXY(2,:), CList(i+1,:), 'FaceAlpha', .4, 'EdgeColor', 'none');
end
% 绘制白色边缘线
if 1
for i = 0:setNum-1iXY = rM^i*cXY;plot(iXY(1,:), iXY(2,:), 'Color', 'w', 'LineWidth', 1.2);
end
end
fill(cos(cT).*2.3, sin(cT).*2.3, [1,1,1], 'EdgeColor', 'none')% 绘制文本信息
for i = 1:setNumtR = (i-1)*rT/pi*180;if tR>=0 && tR<=180tR = tR-90;elsetR = tR+90;endtext(cos((i-1)*rT).*13, sin((i-1)*rT).*13, num2str(uniq(i)),...'HorizontalAlignment', 'center',...'VerticalAlignment', 'middle',...'Rotation', tR,...numFont{:})text(cos((i-1)*rT).*17, sin((i-1)*rT).*17, setName{i},...'HorizontalAlignment', 'center',...'VerticalAlignment', 'middle',...'Rotation', tR,...labFont{:})
end
text(0, 0, {'core';num2str(core)},...'HorizontalAlignment', 'center',...'VerticalAlignment', 'middle',...labFont{:})