MATLAB程序设计教程 第3版 第四章实验指导、思考练习答案(个人版)
)
注:本系列文章仅仅用于交流学习,杜绝作业抄袭
第一章:MATLAB程序设计教程 第3版 第一章实验指导、思考练习答案(个人版)-CSDN博客
第二章:MATLAB程序设计教程 第3版 第二章实验指导、思考练习答案(个人版)-CSDN博客
第三章:MATLAB程序设计教程 第3版 第三章实验指导、思考练习答案(个人版)-CSDN博客
第四章:MATLAB程序设计教程 第3版 第四章实验指导、思考练习答案(个人版)-CSDN博客
第五章:MATLAB程序设计教程 第3版 第五章实验指导、思考练习答案(个人版)-CSDN博客
第六章:MATLAB程序设计教程 第3版 第六章实验指导、思考练习答案(个人版)-CSDN博客
实验指导:

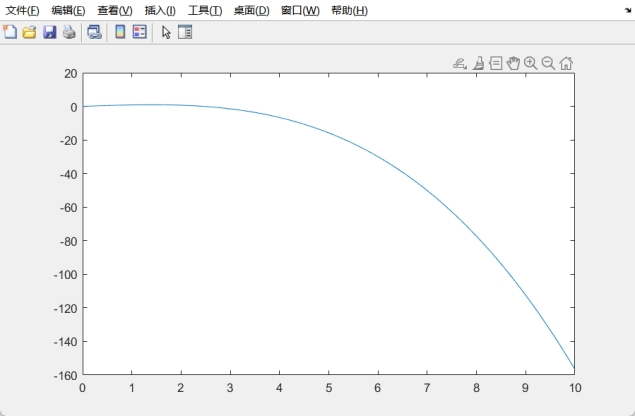
x=0:1/1000:10;y=x-x.^3./6;plot(x,y)
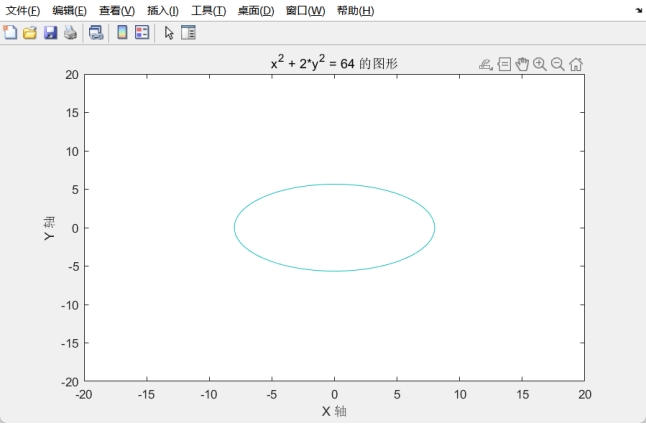
ezplot(@(x, y) x.^2 + 2*y.^2 - 64, [-20, 20, -20, 20]); % 范围可能需要根据方程进行调整title('x^2 + 2*y^2 = 64 的图形');xlabel('X 轴');ylabel('Y 轴');

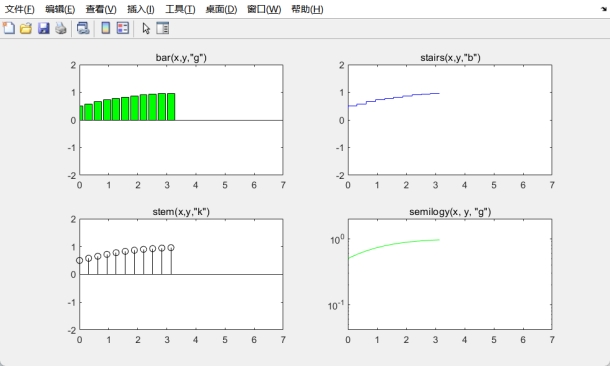
x=-pi:pi/10:pi;y=1./(1+exp(-1*x));subplot(2,2,1);bar(x,y,'g');title('bar(x,y,"g")');axis([0,7,-2,2]);subplot(2,2,2);stairs(x,y,'b');title('stairs(x,y,"b")');axis([0,7,-2,2])subplot(2,2,3);stem(x,y,'k');title('stem(x,y,"k")');axis([0,7,-2,2]);subplot(2,2,4);semilogy(x, y, 'g'); title('semilogy(x, y, "g")');axis([0,7,-2,2]);%subplot(2,2,5);semilogx(x, y, 'b'); %title('semilogx(x, y, "b")');axis([0,7,-2,2]);

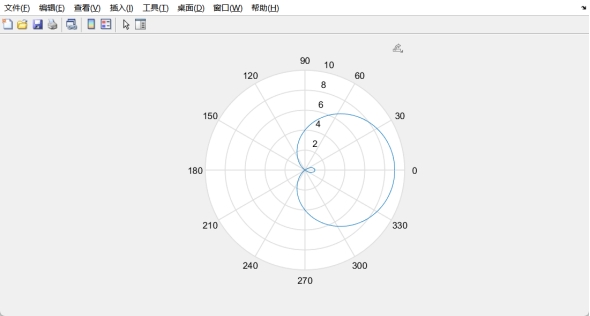
theta=0:0.01:2*pi;rho=5.*cos(theta)+4;polar(theta,rho)
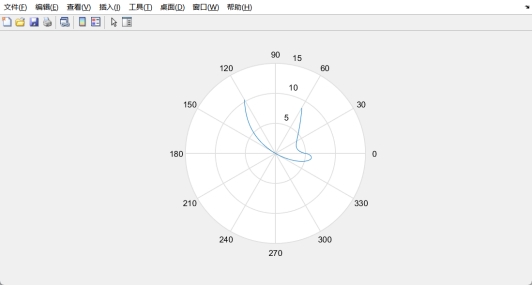
theta=-pi/3:0.01:pi/3;rho=(5*sin(theta).^sin(theta))./cos(theta);polar(theta,rho)
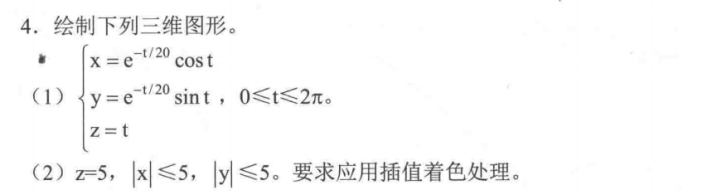
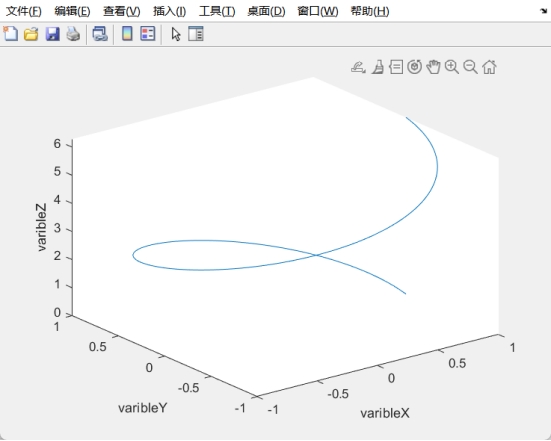
t = 0:pi/100:2*pi;x = exp(0).^(-t/20).*cos(t);y = exp(0).^(-t/20).*sin(t);z = t;plot3(x,y,z);xlabel('varibleX');ylabel('varibleY');zlabel('varibleZ');
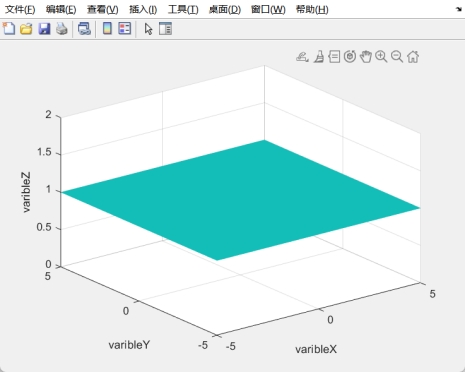
x = -5:0.01:5;y = -5:0.01:5;[X, Y] = meshgrid(x, y);Z = ones(size(X));surf(X, Y, Z);shading interp;xlabel('varibleX');ylabel('varibleY');zlabel('varibleZ');

% 创建一个时间向量t = linspace(0, 4*pi, 100);% 创建一个新的图形窗口figure;for i = 1:length(t)% 计算球体的半径,这里使用正弦函数使得半径随时间变化radius = 1 + 0.5*sin(t(i));% 创建球体的坐标[x, y, z] = sphere(50); % 创建球体坐标数据x = x * radius; % 根据半径调整 x 坐标y = y * radius; % 根据半径调整 y 坐标z = z * radius; % 根据半径调整 z 坐标% 绘制球体并设置一些属性surf(x, y, z, 'EdgeColor', 'none'); % 绘制球体axis([-2 2 -2 2 -2 2]); % 设置坐标轴范围title(sprintf('Frame: %d', i)); % 显示当前帧数drawnow; % 更新绘图窗口% 添加适当的延时,控制动画播放速度pause(0.1);% 在绘制下一帧前清除图形clf;end

思考练习
一、填空题
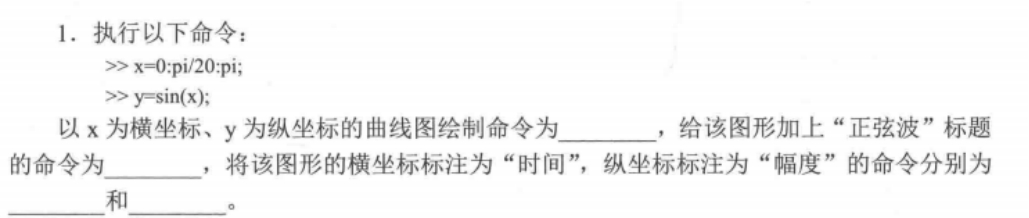
plot(x,y) title(‘正弦波’) xlable(‘时间’) ylable(‘幅度’)

3

hold on axis([-3 3 -5 20])
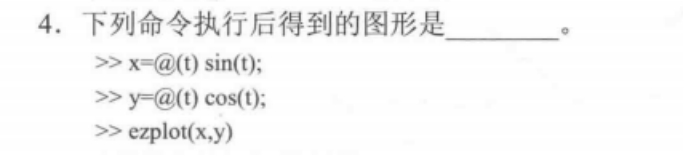
单位圆

五个同心圆,半径依次为1,3,5,7,9
二、问答题

1、使用plot函数:使用多次plot函数调用来绘制多条曲线。每次调用plot函数时,指定不同的数据点作为曲线的 x 和 y 值。例如:
x1 = 0:0.1:2*pi;
y1 = sin(x1);
x2 = 0:0.1:2*pi;
y2 = cos(x2);
plot(x1, y1, x2, y2)
2、使用hold on和hold off:使用hold on命令来保持当前的坐标轴,并允许多次绘制,然后使用hold off命令来恢复默认行为。例如:
x = 0:0.1:2*pi;
y1 = sin(x);
y2 = cos(x);
plot(x, y1)
hold on
plot(x, y2)
hold off
3、使用数组方式:将要绘制的曲线数据存储在一个矩阵或向量中,然后使用plot函数一次性绘制所有的曲线。每一列或每一个元素表示一条曲线的数据。例如:
x = 0:0.1:2*pi;
y = [sin(x); cos(x); tan(x)];
plot(x, y)x=0:0.01:10;
y=1/(2*pi)*exp(-0.5.*x.*x);
plot(x,y)t=0:0.1:2*pi;
x=t.*sin(t);
y=t.*cos(t);
plot(x,y);
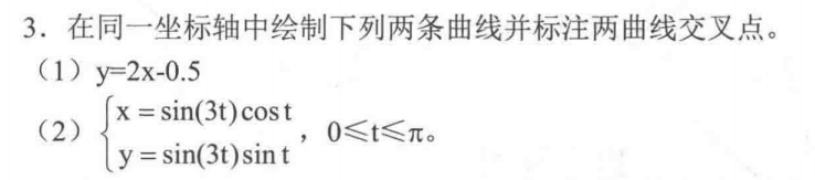
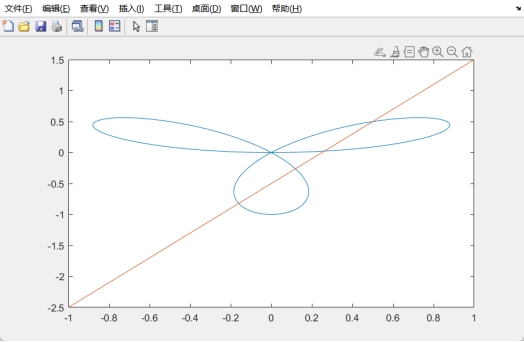
t=0:0.01:2*pi;x=sin(3*t).*cos(t);y=sin(3*t).*sin(t);plot(x,y);hold on;x=-1:0.01:1;y=2*x-0.5;plot(x,y);hold off

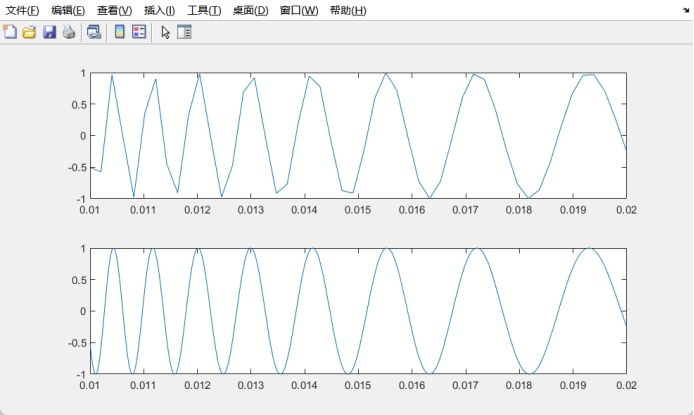
x=linspace(0.01,0.02,50);y=sin(1./x);subplot(2,1,1),plot(x,y);subplot(2,1,2),fplot(@(x)sin(1./x),[0.01,0.02]);

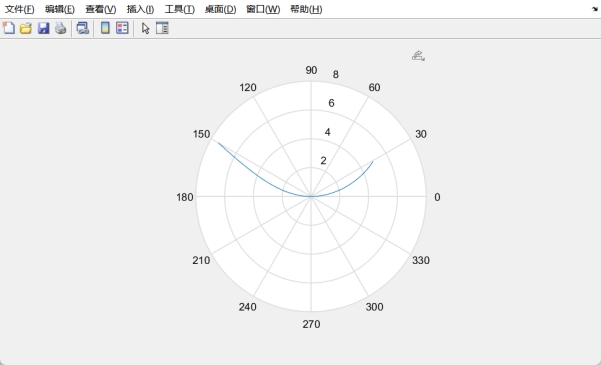
t = 0:pi/100:2*pi;r = 12./sqrt(t);polar(t,r);

a = 3;t = -pi/6:pi/100:pi/6;r = 3*a*sin(t).*cos(t)./(sin(t).^3+cos(t).^3);polar(t,r);

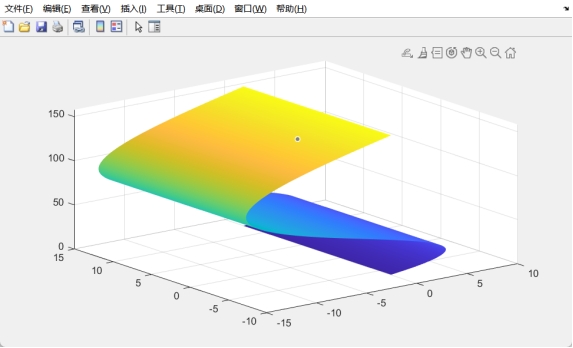
u = 0:pi/100:2*pi;v= 0:pi/100:2*pi;x = 3 * u.*sin(v);y = 2*u.*cos(v);[U,V] = meshgrid(u,v);z = 4*U.^2;surf(x,y,z);shading interp;
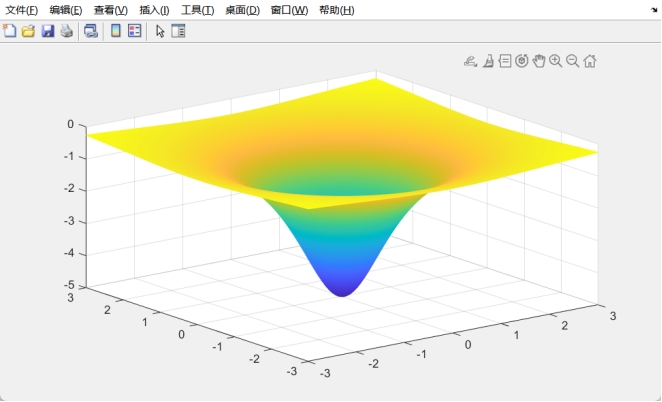
x = -3:0.01:3;y = -3:0.01:3;[X,Y] = meshgrid(x,y);z = -5./(1+X.^2+Y.^2);mesh(x,y,z);shading interp;