【案例】echarts线性图

效果图:
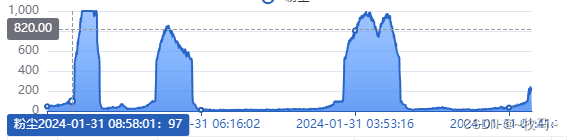
代妈:
// 需导入echarts,导入不成功,在package.json中查看是否下载echarts插件
import * as echarts from 'echarts';
//  echarts 图EchartLine(_list) {console.log(_list, '*-*-');let X_Data = []; let data = []; let name = '';_list.forEach(ele => {name = ele.label;X_Data.push(ele.time);data.push(ele.value)})var chartDom = document.getElementById('echarts');var myChart = echarts.init(chartDom);var option;const colors = ['#265eb8'];option = {color: colors,tooltip: {trigger: 'none',axisPointer: {type: 'cross'}},legend: {},grid: {top: 25,bottom: 25,left: 40,right: 25},xAxis: [{type: 'category',axisTick: {alignWithLabel: true},axisLine: {onZero: false,lineStyle: {color: colors[0]}},axisPointer: {label: {formatter: function (params) {console.log(params);return (params.seriesData[0].seriesName + params.value + (params.seriesData.length ? ':' + params.seriesData[0].data : '') );}}},// prettier-ignoredata: X_Data}],yAxis: [ { type: 'value' } ],series: [{name: name,type: 'line',smooth: true,emphasis: { focus: 'series' },data:data,areaStyle: {color: new echarts.graphic.LinearGradient(0, 0, 0, 1, [{ offset: 0,  color: '#6d9eeb' },{ offset: 0.5,  color: '#4a89ee' },{ offset: 1, color: '#236ad9' }])}}]};option && myChart.setOption(option, true);},