import numpy as np
import matplotlib.pyplot as plt
from matplotlib.animation import FuncAnimation
fig, ax = plt.subplots()
ln,= ax.plot([],[],'-',color='r', lw=1)
time_template ='LOVE = %.1fs'
time_text = ax.text(0.05,0.9,'', transform=ax.transAxes)definit():ax.set_xlim(-3,3)ax.set_ylim(-2,3)return ln,defupdate(ii):xdata, ydata =[],[]for i inrange(0,183):xi=(182-i)/100xdata.append(0.01*i-1.82)yi=(xi**(2/3))+(0.9*(3.3-xi**2)**0.5)*np.cos(ii*(np.pi)*xi)iftype(yi)=='complex':yi=np.around(abs(yi),decimals=4)yi=np.around(yi, decimals=3)ydata.append(yi)for i inrange(0,182):xi=i/100xdata.append(xi) yi=(xi**(2/3))+(0.9*(3.3-xi**2)**0.5)*np.cos(ii*(np.pi)*xi)iftype(yi)=='complex':yi=np.around(abs(yi),decimals=4)yi=np.around(yi, decimals=3)ydata.append(yi)ln.set_data(xdata, ydata)time_text.set_text(time_template %(ii))return ln,
ani = FuncAnimation(fig, update, np.linspace(0,13.14,100),init_func=init, interval=100)
ani.save('love.gif', writer='imagemagick', fps=60)
plt.show()
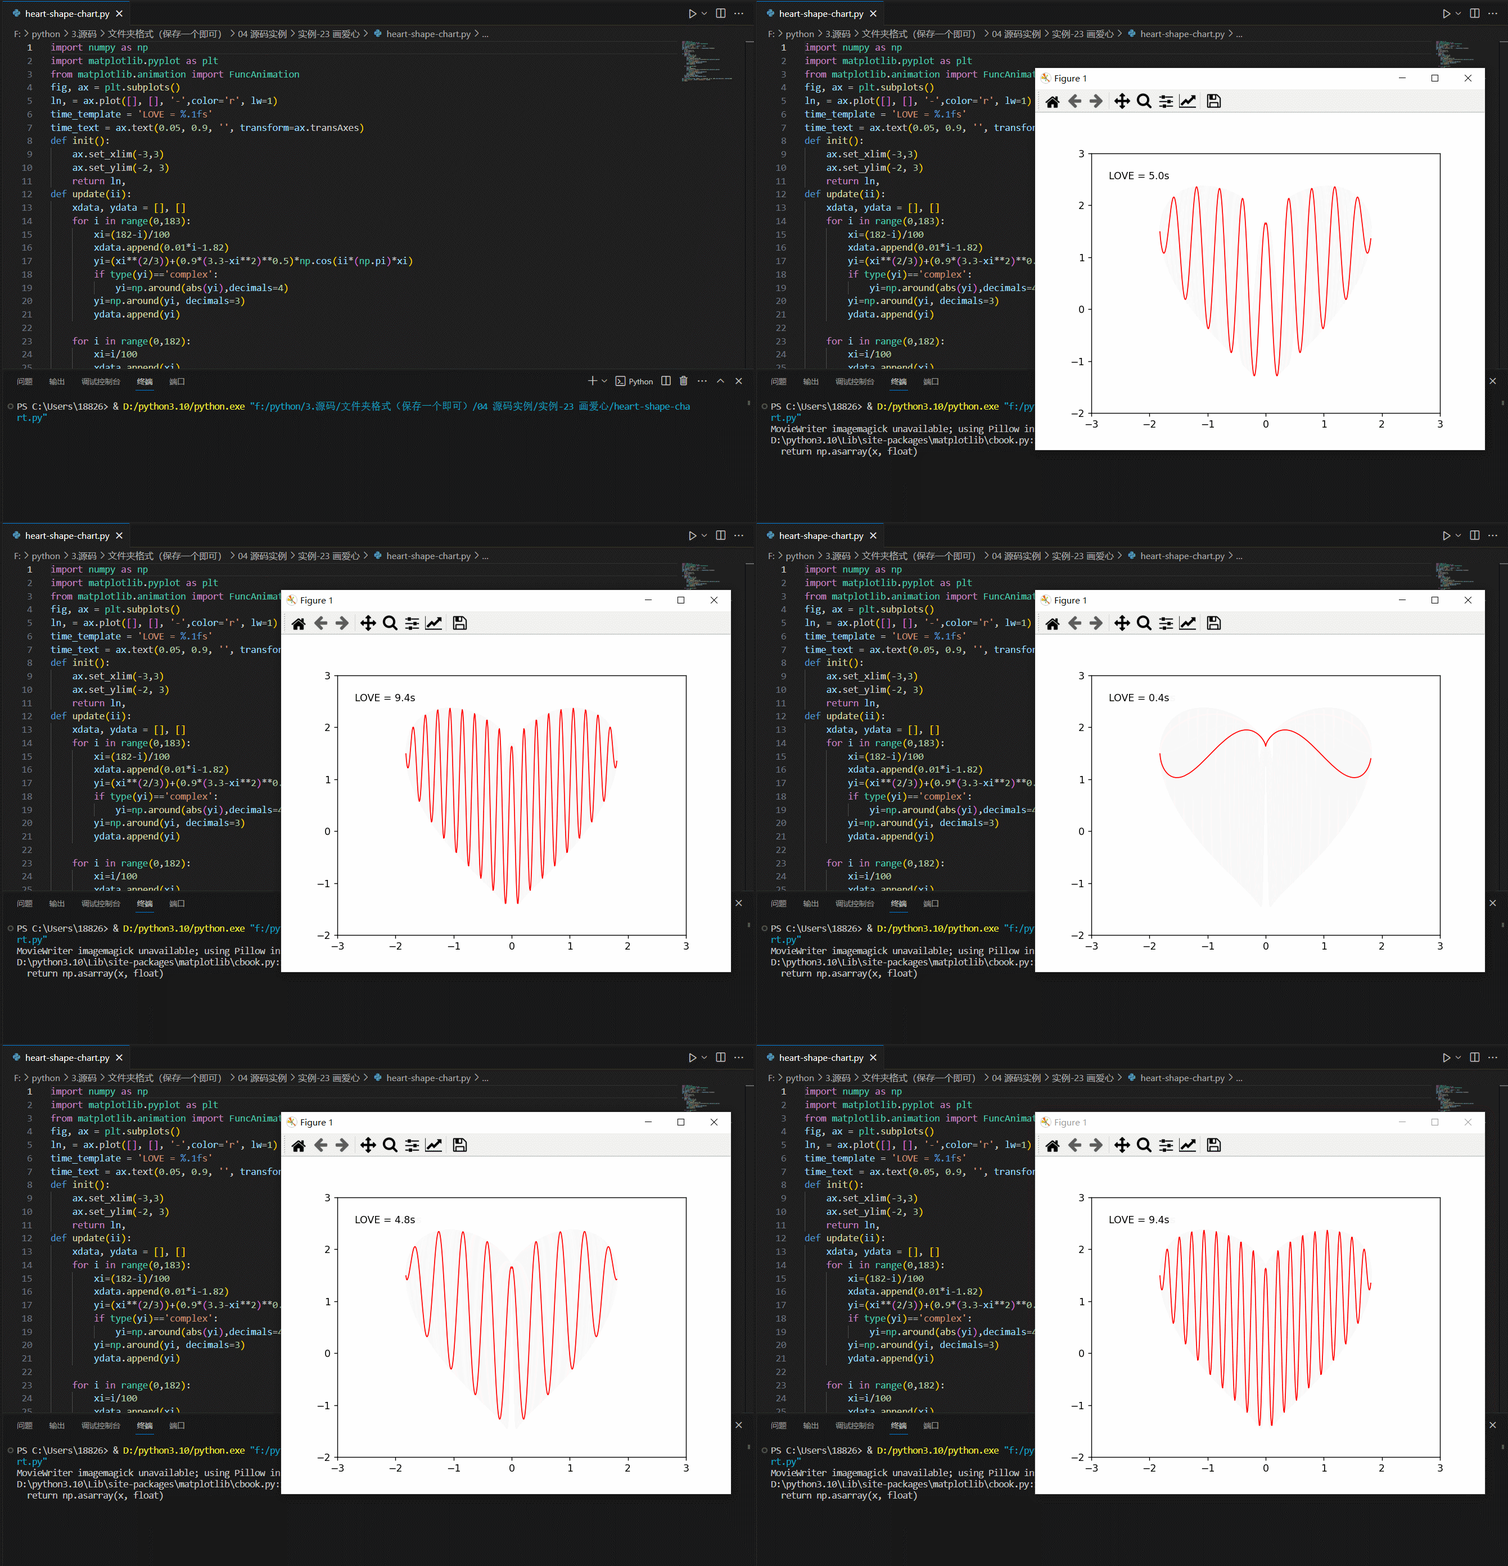
效果
heart-stitching-by-string
代码
print('\n'.join([''.join([('ForChange'[(x-y)%8]if((x*0.05)**2+(y*0.1)**2-1)**3-(x*0.05)**2*(y*0.1)**3<=0else' ')for x inrange(-30,30)])for y inrange(15,-15,-1)]))
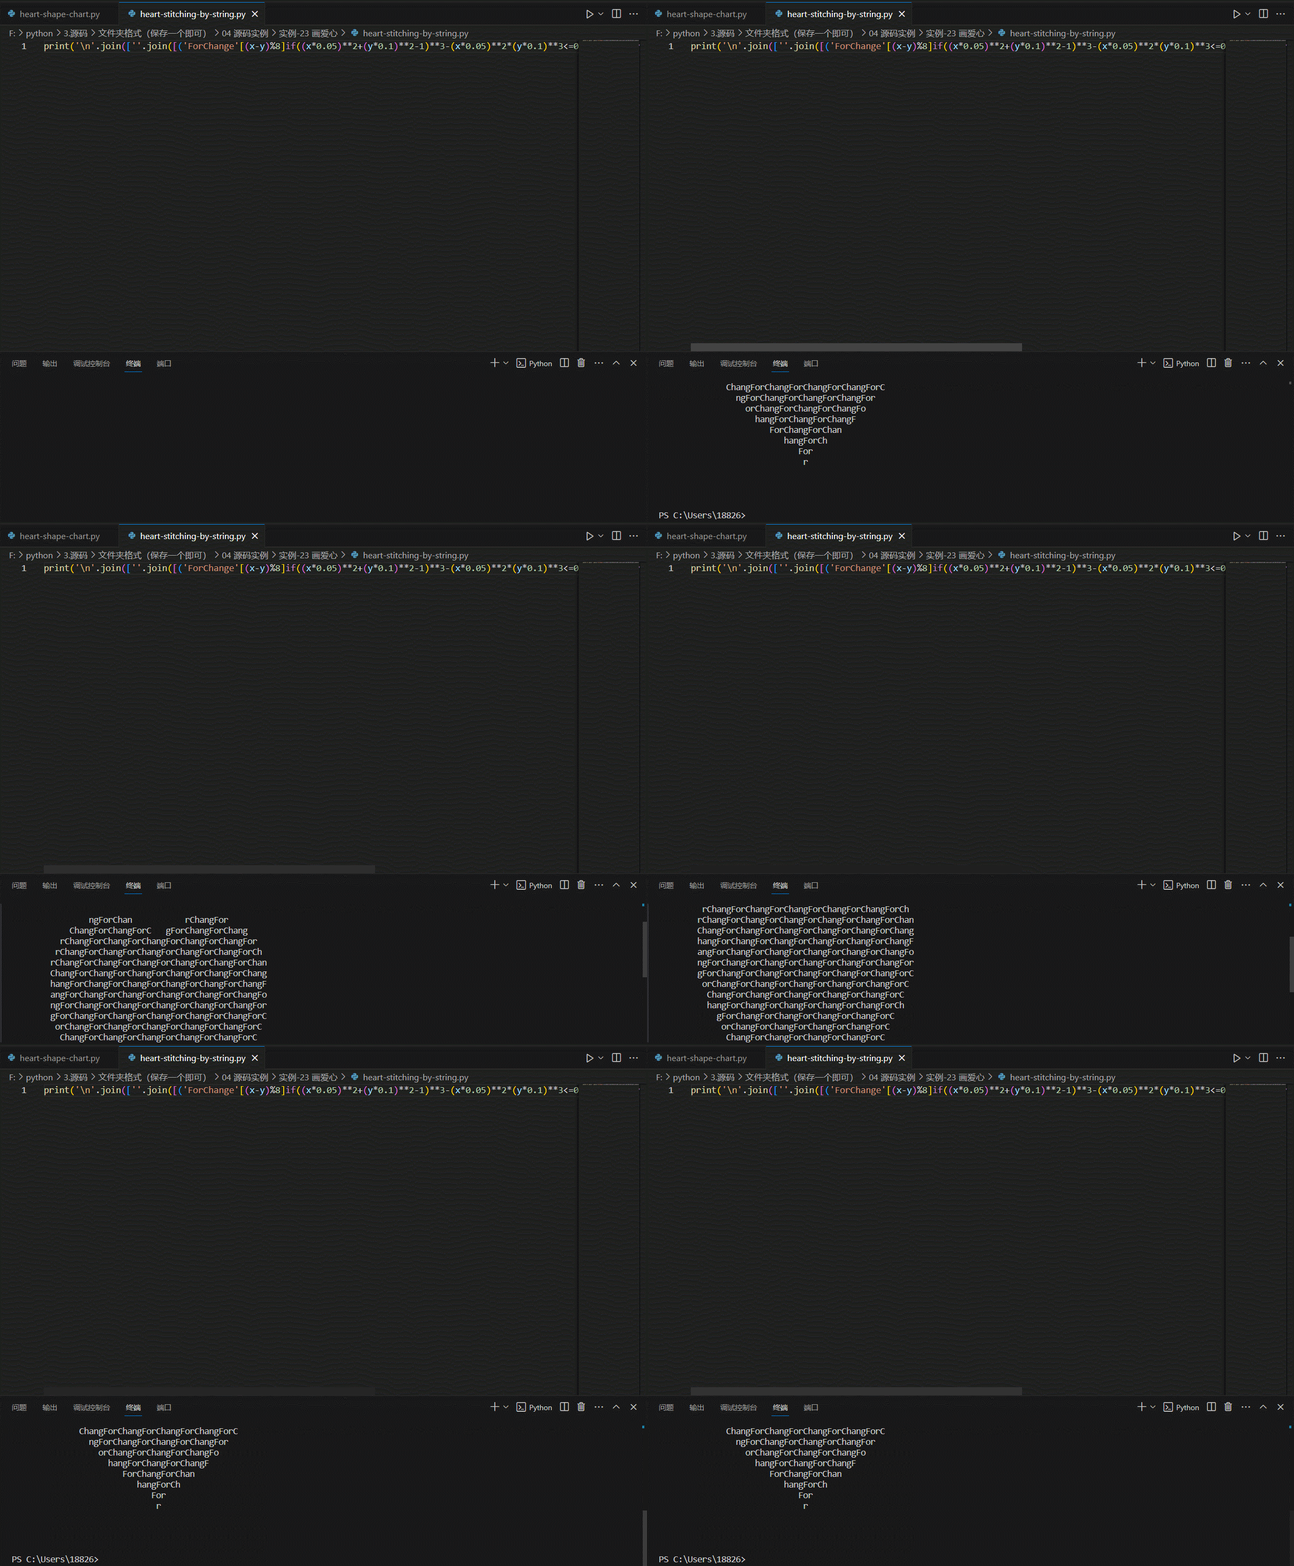
效果
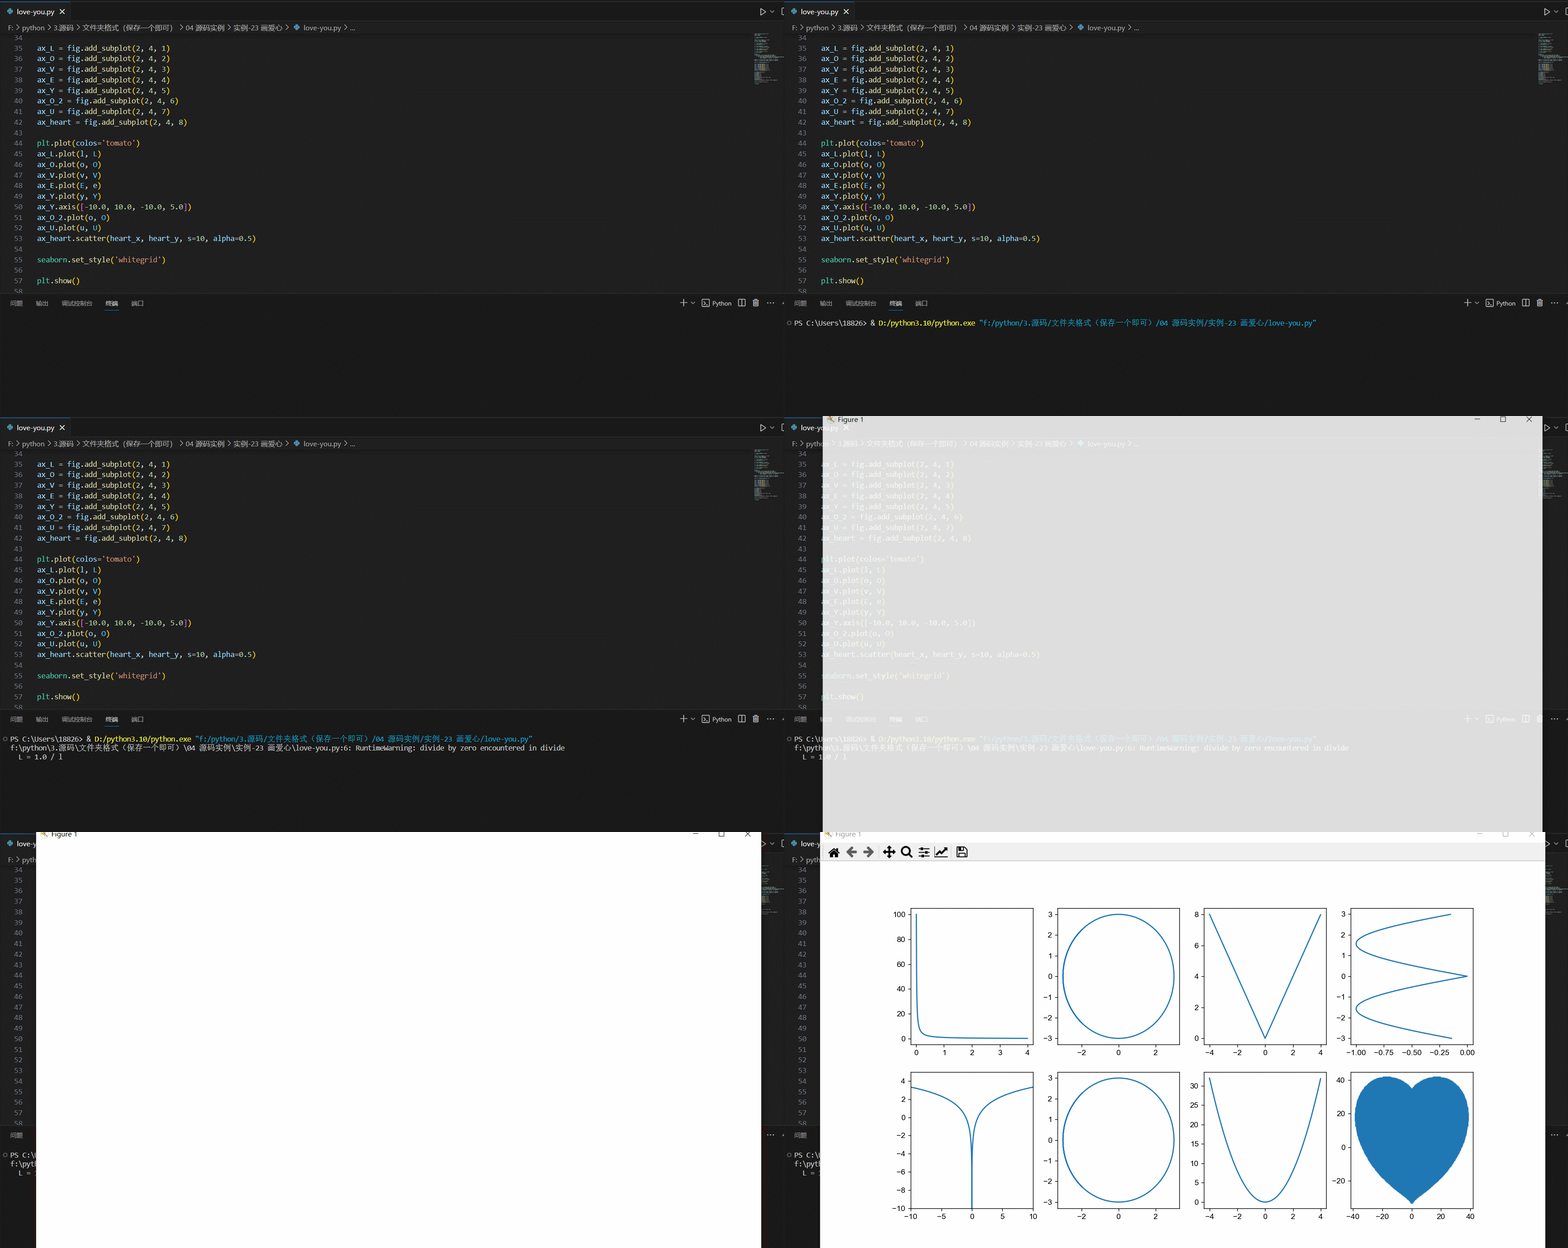
love-you
代码
import matplotlib.pyplot as plt
import seaborn
import numpyl = numpy.arange(0,4,0.01)
L =1.0/ ltheta = numpy.arange(-4,4,0.01)
o =3.0* numpy.cos(theta)
O =3.0* numpy.sin(theta)v = numpy.arange(-4,4,0.01)
V = numpy.abs(-2.0* v)e = numpy.arange(-3,3,0.01)
E =-1.0* numpy.abs(numpy.sin(e))y = numpy.arange(-10,10,0.01)
Y = numpy.log2(numpy.abs(y))u = numpy.arange(-4,4,0.01)
U =2.0* u **2points =[]for heartY in numpy.linspace(-100,100,500):for heartX in numpy.linspace(-100,100,500):if((heartX*0.03)**2+(heartY*0.03)**2-1)**3-(heartX*0.03)**2*(heartY*0.03)**3<=0:points.append({"x": heartX,"y": heartY})heart_x =list(map(lambda point: point["x"], points))
heart_y =list(map(lambda point: point["y"], points))fig = plt.figure(figsize=(13,7))ax_L = fig.add_subplot(2,4,1)
ax_O = fig.add_subplot(2,4,2)
ax_V = fig.add_subplot(2,4,3)
ax_E = fig.add_subplot(2,4,4)
ax_Y = fig.add_subplot(2,4,5)
ax_O_2 = fig.add_subplot(2,4,6)
ax_U = fig.add_subplot(2,4,7)
ax_heart = fig.add_subplot(2,4,8)plt.plot(colos='tomato')
ax_L.plot(l, L)
ax_O.plot(o, O)
ax_V.plot(v, V)
ax_E.plot(E, e)
ax_Y.plot(y, Y)
ax_Y.axis([-10.0,10.0,-10.0,5.0])
ax_O_2.plot(o, O)
ax_U.plot(u, U)
ax_heart.scatter(heart_x, heart_y, s=10, alpha=0.5)seaborn.set_style('whitegrid')plt.show()