【BCC动态跟踪PostgreSQL】

BPF Compiler Collection (BCC)是基于eBPF的Linux内核分析、跟踪、网络监控工具。其源码存放于GitCode - 开发者的代码家园
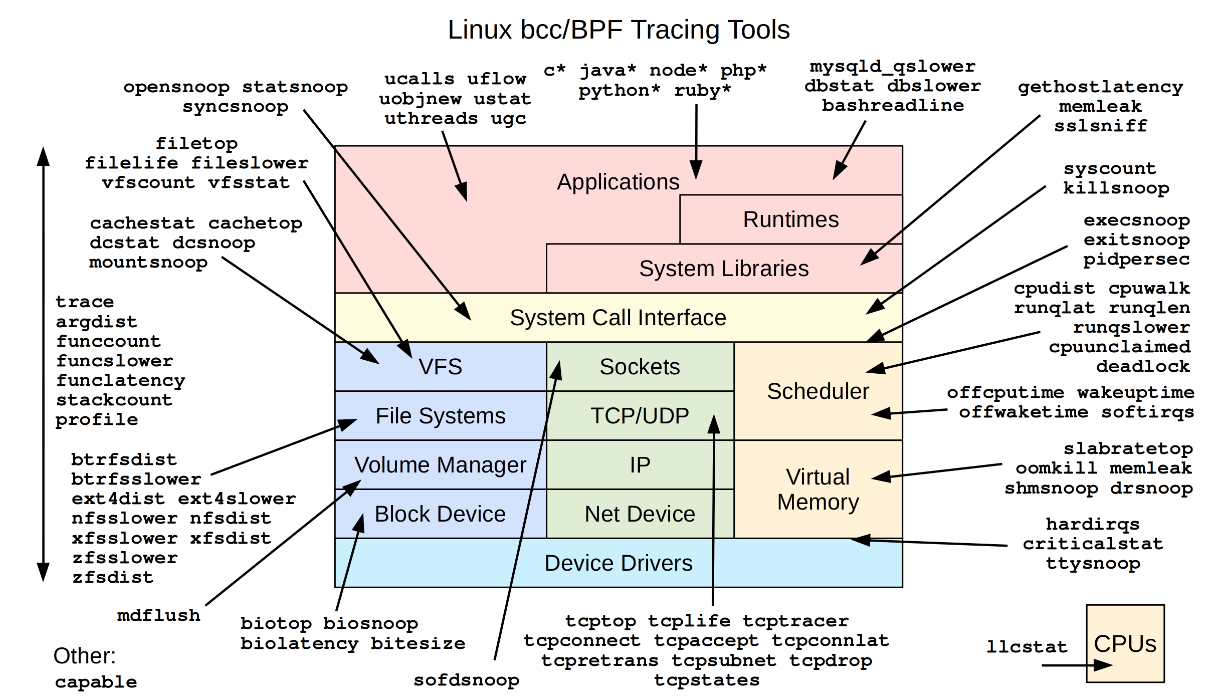
想要监控PostgreSQL数据库的相关SQL需要在编译PostgreSQL的时候开启dtrace。下文主要介绍几个和PostgreSQL相关的工具,其他工具可根据需求自行了解。
1.dbslower:跟踪慢查询,然后打印超出延时的,默认延时是1ms
//终端 1:
[root@localhost tools]# ./dbslower postgres -p 58474//终端 2:
postgres=# select pg_backend_pid();pg_backend_pid
----------------58474
(1 row)
postgres=# select pg_sleep(3);pg_sleep
----------(1 row)
postgres=# select pg_sleep(2);pg_sleep
----------(1 row)
postgres=# select pg_sleep(1);pg_sleep
----------(1 row)
postgres=# select pg_sleep(2);pg_sleep
----------(1 row)/终端1:[root@localhost tools]# ./dbslower postgres -p 58474
Tracing database queries for pids 58474 slower than 1 ms...
TIME(s)        PID          MS QUERY
1.893949       58474  3004.362 select pg_sleep(3);
8.492827       58474  2002.784 select pg_sleep(2);
23.334969      58474  2004.094 select pg_sleep(2);

2.dbstat:跟踪PostgreSQL数据库进程查询,并显示查询延时的直方图
//终端1:
[root@localhost tools]# ./dbstat postgres -p 58518//终端2:
postgres=# select pg_backend_pid();pg_backend_pid
----------------58518
(1 row)
postgres=# select pg_sleep(0.2);pg_sleep
----------(1 row)
postgres=# select pg_sleep(0.2);pg_sleep
----------(1 row)
postgres=# select pg_sleep(0.01);pg_sleep
----------(1 row)
postgres=# select pg_sleep(2);pg_sleep
----------(1 row)//ctrl+c 终端1:
[root@localhost tools]# ./dbstat postgres -p 58518
Tracing database queries for pids 58518 slower than 0 ms...
[02:37:57]query latency (ms)  : count     distribution0 -> 1          : 0        |                                        |2 -> 3          : 0        |                                        |4 -> 7          : 0        |                                        |8 -> 15         : 1        |********************                    |16 -> 31         : 0        |                                        |32 -> 63         : 0        |                                        |64 -> 127        : 0        |                                        |128 -> 255        : 2        |****************************************|256 -> 511        : 0        |                                        |512 -> 1023       : 0        |                                        |1024 -> 2047       : 1        |********************                    |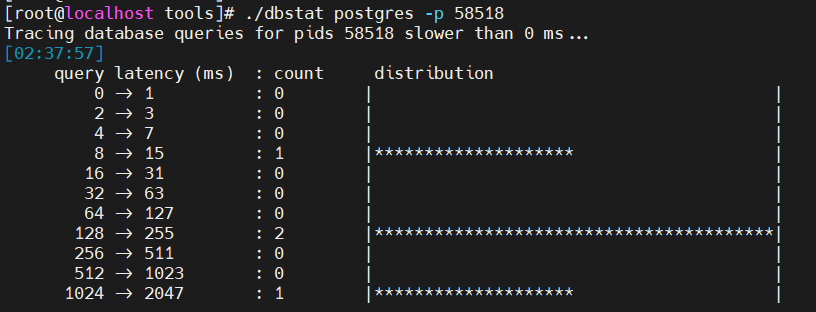
3.execsnoop:跟踪新进程创建,跟踪exec函数
//终端1:
[root@localhost tools]# ./execsnoop//终端2:
[postgres@localhost data_uuid]$ psql
psql (11.20)
Type "help" for help.
postgres=# \q
[postgres@localhost data_uuid]$ psql
psql (11.20)
Type "help" for help.
postgres=# \q
[postgres@localhost data_uuid]$ ls
base          pg_ident.conf  pg_serial     pg_tblspc    postgresql.auto.conf
global        pg_logical     pg_snapshots  pg_twophase  postgresql.conf
pg_commit_ts  pg_multixact   pg_stat       PG_VERSION   postmaster.opts
pg_dynshmem   pg_notify      pg_stat_tmp   pg_wal       postmaster.pid
pg_hba.conf   pg_replslot    pg_subtrans   pg_xact
[postgres@localhost data_uuid]$ cat /etc/hosts
127.0.0.1   localhost localhost.localdomain localhost4 localhost4.localdomain4
::1         localhost localhost.localdomain localhost6 localhost6.localdomain6//终端1:
[root@localhost tools]# ./execsnoop
PCOMM            PID    PPID   RET ARGS
psql             58579  43545    0 /home/postgres/soft-11-20_uuid/bin/psql
psql             58582  43545    0 /home/postgres/soft-11-20_uuid/bin/psql
ls               58584  43545    0 /bin/ls --color=auto
cat              58585  43545    0 /bin/cat /etc/hosts
4.filetop:文件读和写的top(文件系统相关)
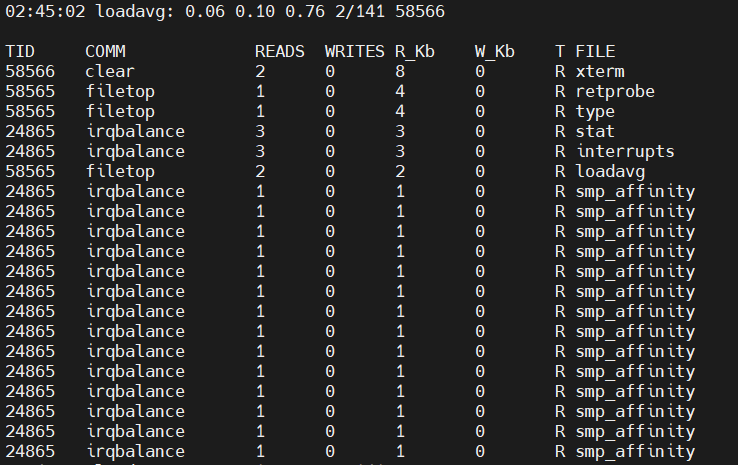
[root@localhost tools]# ./filetop02:45:02 loadavg: 0.06 0.10 0.76 2/141 58566TID     COMM             READS  WRITES R_Kb    W_Kb    T FILE
58566   clear            2      0      8       0       R xterm
58565   filetop          1      0      4       0       R retprobe
58565   filetop          1      0      4       0       R type
24865   irqbalance       3      0      3       0       R stat
24865   irqbalance       3      0      3       0       R interrupts
58565   filetop          2      0      2       0       R loadavg
24865   irqbalance       1      0      1       0       R smp_affinity
24865   irqbalance       1      0      1       0       R smp_affinity
24865   irqbalance       1      0      1       0       R smp_affinity
24865   irqbalance       1      0      1       0       R smp_affinity
24865   irqbalance       1      0      1       0       R smp_affinity
24865   irqbalance       1      0      1       0       R smp_affinity
24865   irqbalance       1      0      1       0       R smp_affinity
24865   irqbalance       1      0      1       0       R smp_affinity
24865   irqbalance       1      0      1       0       R smp_affinity
24865   irqbalance       1      0      1       0       R smp_affinity
24865   irqbalance       1      0      1       0       R smp_affinity
24865   irqbalance       1      0      1       0       R smp_affinity
24865   irqbalance       1      0      1       0       R smp_affinity
24865   irqbalance       1      0      1       0       R smp_affinity